Aparentemente, parece que só eu percebo, mesmo...
Não interessa a diferença. Até podia ser mais pronunciada do que nos preços correntes. Interessa o rigor dos dados e da sua interpretação.
O gráfico que apresentas corrige os valores pelas taxas de inflação. Não chega. Não elimina nada no que diz respeito às taxas de câmbio. Não existe uma só medida que consiga eliminar todas as deficiências quanto se trata de comparar o nível de riqueza dos países, mas usar a PPP é a forma mais robusta de o fazer:
https://www.imf.org/external/datamap...PPC@WEO/USA/EU
Isto tudo sem levar em linha de conta que os USA são sempre os mesmos enquanto que a UE depois da introdução do Euro "anexou" mais uns 10 países, todos pobres e portanto todos a puxar o PIB para baixo.
Aqui vai um artigo interessante sobre estes assuntos, com incidência também no peso relativo dos EUA e UE na economia global.
https://www.bruegel.org/analysis/eur...-united-states
Esta bem pronto
Tu e que sabes
MAs olhas neste artigo do Centre for European Reform
eles explicam que existe [

]
https://www.cer.eu/insights/why-europe-should-not-worry-about-us-out-performance
e começa assim
The US has had stronger growth than Europe recently – but its out-performance is easily explainable. Instead of worrying about the US, Europe should focus on itself and avoid repeating past mistakes.
Ou seja a europa tem um think tank dedicados a estas coisas e diz que ha um gap e aa cescer, analiza as causas do GAP que existe e diz para nao nos preocuparmos coim isso que eles sabem que existe e porque
Ora vamos entao ver o que diz a europa sobre o assunto
"
- The US has faster population growth and more favourable demographics.
- The US has become a net exporter of energy while Europe cannot meet all its energy demand with its scarce domestic energy sources, and consequently pays high prices for imports.
- The US has had both greater fiscal space to stimulate its economy and far greater willingness to use it.
"
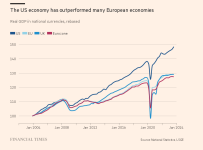
"Instead of comparing economic size over time, it is therefore better to focus on differences in real economic growth between the US and the EU. This allows us to focus on underlying performance without the impact of currency fluctuations or the limitations of PPP calculations. As shown on Chart 1, cumulatively, the US has grown 8 per cent more than the EU since 2010. The US engineered stronger recoveries from both the 2008 global financial crisis (GFC) and the Covid pandemic, while the EU lost years of growth to the eurozone fiscal crisis. More than half of the growth gap between the EU and the US opened up between 2011 and 2013."

Relativamente ao dizers que a europa nao cresce debido aos novas entradas na UE, a verdade é pura e simplesmente o contrario, sem o crescimento da lituania, estonia, e sobretudo da polonia o PIB pura e simplesmenet mao mexe pra repara
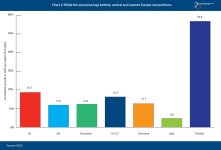
Sao paises novos que trazem crescomento [

]
A produtividade media da EU tem crescido ate mais mas gracas aos novos paises, porque os mais antigos estao estagnados

"
Conclusion
The US has outperformed Europe on economic growth since 2010. Some of this can be explained by self-inflicted wounds and austerity politics in Europe, notably during the eurozone crisis, but there are also clear, structural advantages that the US has benefited from. With a demographic tailwind relative to Europe, an abundant and cheap energy supply, and a looser budget policy, US out-performance should come as no surprise. But the rapid growth in shale oil and gas production
is largely over and the US will not be able to run an expansive fiscal policy forever.
European policy-makers can take some consolation in good productivity growth and are already taking steps to address Europe’s energy crisis. In many countries, governments are seeking to raise immigration to tackle demographic problems. But Europe must also avoid repeating the mistakes of the eurozone crisis and austerity era: if new self-inflicted wounds can be avoided Europe need not fret too much about its underperformance vis-a-vis the US.
"
Agora pronto cada um que retire as suas conclusoes


 ]
]