Anúncio

Collapse
No announcement yet.

covid 19 - a parte estatistica e matemática da pandemia

Collapse

Ads nos topicos Mobile

Collapse

Ads Nos topicos Desktop

Collapse
X
Collapse
Primeira Anterior Próxima Última
 
  • Filtrar
  • Tempo
  • Show
Clear All
new posts

    Os poderes dos supertransmissores que fazem o vírus correr


    Numa conjuntura em que não haja distanciamento físico e higiene social, cada infetado com covid-19 contagia, em média, duas a três pessoas. Mas há alguns indivíduos com capacidade para transmitir o vírus a dezenas. São os supertransmissores.

    Sem a implementação de medidas de saúde pública e num cenário em que ninguém tem anticorpos, estima-se que cada doente infetado com o novo coronavírus transmita, em média, a infeção a duas ou três pessoas. Trata-se do indicador "R0" (ou número básico de reprodução), que permite aferir o nível de contágio expectável de um vírus e ter uma noção das medidas necessárias para reduzi-lo. Sendo uma média, é possível que parte dos infetados não contagie ninguém e que outros indivíduos sejam capazes de transmitir o vírus a muito mais pessoas.

    O fenómeno de supertransmissão também foi observado com o ébola, a febre tifoide, o VIH e a síndrome respiratória aguda grave (SARS-CoV)

    Um estudo de investigadores da Escola de Higiene e Medicina Tropical de Londres, publicado em abril com base em dados de fevereiro da Organização Mundial da Saúde, estima que cerca de 80% dos casos de infeção pelo novo coronavírus analisados tenham sido provocados por cerca de 10% dos infetados. Os investigadores analisaram o número médio de contágios causados por cada pessoa infetada, a variação no número de transmissões secundárias e os chamados eventos de supertransmissão (ou superdisseminação), que acontece quando um doente - o supertransmissor - é capaz de infetar dezenas de outras pessoas. E concluíram que "nem todos os casos sintomáticos causam uma transmissão secundária", sendo que 80% destas "podem ter sido causadas por uma pequena fração de indivíduos infeciosos" (cerca de 10% do total de infetados). Outro estudo, publicado em maio por investigadores de Santiago de Compostela, com base numa amostra de mais de 4700 genomas do vírus, sugere que dezenas de indivíduos que contagiaram 20 a 30 pessoas podem ter estado na origem de metade dos casos.
    Em ambas as investigações, os especialistas alertam para a necessidade de identificar os potenciais supertransmissores e analisar as suas características biológicas e comportamentais, para controlar os surtos.
    Supertransmissões no SARS-CoV de 2003
    Um estudo científico de 2004 sobre o surto de SARS-CoV em Hong Kong e Singapura (2002/03) revelou que 71,1% e 74,8% das infeções por SARS-CoV nos dois territórios, respetivamente, estavam relacionadas com eventos de supertransmissão e que estes tinham sido "responsáveis por quase três quartos das infeções". Ainda que os especialistas não tenham descoberto, com rigor, o que fez com que um indivíduo fosse um supertransmissor, os resultados da investigação sugeriram que a admissão tardia num hospital (mais de quatro dias) após o início dos sintomas pode ter sido "parcialmente responsável pela ocorrência de eventos de supercontágio, especialmente durante a fase inicial da epidemia". Isto porque "os pacientes internados tardiamente poderiam ter desenvolvido uma carga viral elevada",
    Ainda assim, ressalvaram, a transmissão da doença pode ser também influenciada por "fatores epidemiológicos e ambientais", relacionados com as características do agente, do infetado e do meio. Assim sendo, estes tipos de fenómenos "devem ser investigados devidamente para identificar os fatores subjacentes comuns para a prevenção eficaz da SARS no futuro", concluíam, à data, os especialistas.
    Comentário


      Why Portugal's Covid-19 test rate is more than double almost every other nation

      Comentário


        Immunity is not binary

        by Gertrud U. Rey
        Does a first infection with SARS-CoV-2 make a person immune to a second infection? This question is one of the prevailing issues in the current pandemic.
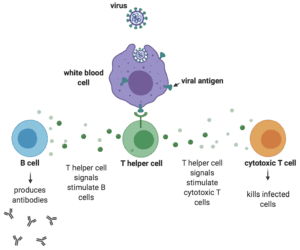
        The relevant immune response is adaptive immunity, which initiates during a first exposure to a pathogen and protects from re-infection and disease upon a second exposure to the same pathogen. During that first exposure, T helper cells sense the presence of one or more proteins (i.e., antigens) on the surface of the invading pathogen and release a variety of signals that ultimately stimulate B cells to secrete antibodies to those antigens. However, antibodies only constitute half of the adaptive immune response. The other half – cell-mediated immunity – is just as important and at the very least results in activation of white blood cells that destroy ingested microbes and cytotoxic T cells that directly kill infected target cells.
        The authors of a review published in the Journal of General Virology summarize some of the recent data obtained in regard to antibody responses to SARS-CoV-2 infection. They then compare these data to what is known about antibody responses to the six other coronaviruses that cause infection in humans. These viruses include the four endemic seasonal human coronaviruses – NL63, 229E, HKU1, and OC43 – as well as Middle East respiratory syndrome coronavirus (MERS-CoV) and SARS-CoV, the virus responsible for the 2002-2004 SARS epidemic.
        Most children produce antibodies to the four seasonal coronaviruses by the age of six. However, this antibody immunity likely wanes over time, because these viruses cause 22-25% of acute respiratory illness in adults. Even so, infection in adults results in low virus titers and usually only causes mild illness, suggesting that most infected individuals maintain at least some immune memory from their childhood. A study with human volunteers showed that ten out of fifteen adults inoculated with 229E virus became infected, and eight of these individuals developed clinical symptoms. All ten infected volunteers mounted antibodies that were neutralizing, meaning that they didn’t just bind viral antigens, but inactivated the virus and prevented infection of new cells. These neutralizing antibodies peaked at three weeks post-infection and dropped steadily until they reached baseline levels one year later. When previously infected subjects were intentionally re-infected with the same coronavirus at the one year mark, 66% of them became infected, but none developed clinical symptoms, suggesting that there was sufficient immune memory to prevent disease. Similarly, research with MERS-CoV and SARS-CoV shows that a primary infection with these viruses results in total binding antibodies and neutralizing antibodies, and that both types of antibodies decrease to a minimal detectable level by two to three years after infection.
        Most of the SARS-CoV-2 antibody data obtained so far align with those observed with the other known coronaviruses, with most infected individuals having detectable antibodies by 10-14 days after onset of symptoms. One group studying antibody responses in hospitalized people in China measured these responses using three different assays. The first assay detected total antibodies to the receptor binding domain of the SARS-CoV-2 spike protein, the second assay measured IgM to the same antigen, and the third assay measured IgG against the SARS-CoV-2 nucleoprotein. IgM antibodies appear in the early stages of antibody-mediated immunity and typically bind very strongly to antigens, to the extent that they often cross-react with other, non-specific antigens. IgG antibodies arise later, are a lot more specific than IgM, and provide the majority of antibody-based immunity against invading pathogens. The results showed that 93% of patients produced total antibodies, 83% produced IgM, and 65% produced IgG, by about 11, 12, and 14 days after disease onset, respectively. More studies showing similar results are emerging.
        The gold standard for determining whether a first infection renders a subject immune to a second infection is the “challenge” trial, in which a previously infected person is intentionally re-infected with the same pathogen. However, most experts consider human challenge trials for dangerous pathogens unethical, so these experiments are usually done in non-human primates. One such study in rhesus macaques showed that all animals infected with SARS-CoV-2 were protected from a second infection. Protection was mediated by both antibody and T cell responses and was demonstrated by mild clinical disease or no disease at all. Even though macaques are not people, their immune responses often parallel those of humans and can provide important insights into human immunity.
        Although most human and animal studies suggest that exposure to SARS-CoV-2 elicits a strong immune response, some people don’t seem to produce antibodies after an infection. This anomaly may be due to the inaccuracy of existing antibody tests, which may lack sufficient specificity and sensitivity. In addition, there are many different tests available that are not calibrated against each other, a factor that may further contribute to inconsistencies. Currently available tests also don’t distinguish between total binding antibodies and neutralizing antibodies, a difference that can substantially impact evaluations of immunity and conclusions about whether immunity has been achieved.
        Throughout the current pandemic, the public focus with regard to immunity has been on antibodies. This is partly because T cells are more difficult to measure than antibodies, and are thus unlikely to play a big role in evaluating immunity in previously exposed individuals. Nonetheless, because a well-balanced immune response requires both antibodies and T cells, there is presently no reason to believe that infection with SARS-CoV-2 does not provide at least some level of immunity.
        The ideal immune response is “sterilizing” – meaning that it completely protects against a new infection. However, considering the current fatality rate of SARS-CoV-2 in some people, even a low level immune response that doesn’t protect against infection but prevents serious disease would be welcome. In other words, immunity is not binary and even partial immunity could potentially save a life.


        Comentário


          https://en.wikipedia.org/wiki/Mortality_due_to_COVID-19

          Comentário


            https://www.medrxiv.org/content/10.1....23.20110882v2

            Comentário


              https://swprs.org/studies-on-covid-19-lethality/

              Comentário


                Covid-19 antibodies may only last ‘weeks’, casting doubt on herd immunity

                Comentário


                  https://www.google.com/url?sa=t&sour...MtInHF4KP10_i1

                  Comentário


                    https://www.who.int/news-room/commen...-from-covid-19

                    Comentário


                      https://expresso.pt/coronavirus/2020...dade-coletiva-

                      Comentário


                        Portanto, há uma hipótese (grande ou pequena) de a segunda vaga ser um mito no Inverno, nos países do Hemisfério Norte. A incerteza entre os cientistas dá azo a todo o tipo de conclusões, incluindo a que acabei de referir.

                        Comentário


                          https://fortune.com/2020/08/21/covid...herd-immunity/

                          Survey of India’s 9th-largest city finds COVID antibodies in 52% of the population

                          ...

                          Comentário


                            Comentário


                              interessante é ver que apesar das mulheres serem a maioria dos casos detetados, 55% dos casos, há mais casos mortais de homens

                              a diferença é particularmente notoria em idades abaixo dos 70 anos

                              seria interessante saber as razões para isto, embora uma das provaveis será as mulheres serem tendencialmente mais cuidadosas com a saúde e darem mais importancia aos sintomas

                              Comentário


                                suponhamos que o R0 é de 8, mas metade da população é imune, por razões que não interessam, pode já ter sido contagiada e ter ganho imunidade
                                de qualquer modo é imune, mas não aparece em nenhum teste de anticorpos

                                o resultado é que inicialmente a epidemia se propaga como se o R0 fosse de 4

                                mas a evolução é diferente

                                para R0=4 para termos imunidade a taxa teria de ser de 75%, para R0=8 para termos imunidade a taxa de imunizados terá de ser de 87,5%, mas como 50% já tem apenas é necessário que mais 37,5% das pessoas fiquem contagiadas para termos imunidade

                                além disso há uma diferença na "velocidade" com que a epidemia se propaga

                                quando o R0=8 e metade tem imunidade começa a propagar-se com uma velocidade identica à que se propagaria se R0=4 mas ninguém tivesse imunidade, mas depois a velocidade de propagação diminuiu mais rapidamente

                                ou seja é possivel distinguir os dois casos pela alteração da velocidade de propagação da epidemia

                                mas...

                                as pessoas não são vacas nem ovelhas

                                para parametrizar um modelo heterogeneo é dificil distinguir aquilo que resulta da alteração do comportamento das pessoas e o que deriva da epidemia em si

                                num rebanho ou manada as ovelhas ou vacas não alteram o comportamento de forma a defender-se da propagação de uma epidemia

                                mas as pessoas alteram e muito

                                logo é dificil parametrizar devidamente os modelos heterogeneos que normalmente procuram fazer os ajustes dos diversos paramentros atraves das alterações da propagação de epidemia

                                porque as vacas, galinhas ou ovelhas continuam a sua vida normal, mas as pessoas alteram muito o seu comportamento
                                e normalmente de forma a travar a expansão da epidemia

                                o confunde as tentativas de parametrização dos modelos heterogeneos e normalmente o erro é no sentido de parecer que a imunidade de rebanho é mais baixa do que aquilo que realmente é
                                Editado pela última vez por lll; 16 September 2020, 19:12. Razão: deixei inacabado

                                Comentário


                                  Originalmente Colocado por lll Ver Post
                                  suponhamos que o R0 é de 8, mas metade da população é imune, por razões que não interessam, pode já ter sido contagiada e ter ganho imunidade
                                  de qualquer modo é imune, mas não aparece em nenhum teste de anticorpos

                                  o resultado é que inicialmente a epidemia se propaga como se o R0 fosse de 4

                                  mas a evolução é diferente

                                  para R0=4 para termos imunidade a taxa teria de ser de 75%, para R0=8 para termos imunidade a taxa de imunizados terá de ser de 87,5%, mas como 50% já tem apenas é necessário que mais 37,5% das pessoas fiquem contagiadas para termos imunidade

                                  Usa a fórmula:
                                  https://forum.motorguia.net/off-topi...post1070880428

                                  Comentário


                                    depois de editada a minha mensagem anterior neste topico penso que está sucintamente explicado que os modelos heterogeneos dão resultados diferentes dos homogeneos e não basta ter o R0 para termos tudo o que precisamos para perceber a possivel evoluçao da epidemia

                                    a realidade é muito mais complexa, aliás é muito mais complexa que o modelo simples que usei para demonstrar que o modelo homogeneos não a consegue retratar

                                    adiante:

                                    The Great Covid-19 Versus Flu Comparison Revisited


                                    A consensus is emerging on how deadly the coronavirus really is. But comparing it with past influenza pandemics turns out to be harder than it looks.
                                    By Justin Fox
                                    6 de agosto de 2020, 14:57 WEST

                                    After much back and forth in the early months of the Covid-19 pandemic, a consensus is emerging that the overall risk of dying for those infected with the disease — at least so far, in a population with an age distribution roughly similar to that of the U.S. or Europe — is about 6 or 7 in 1,000. The Centers for Disease Control and Prevention upwardly revised its “best estimate” of the fatality rate in July to 0.65% from 0.26%. An occasionally updated “meta-analysis” by Australian researchers Gideon Meyerowitz-Katz and Lea Merone of all relevant studies on the disease has it at 0.68%.


                                    This isn’t much below the approximately 1% estimated in a Feb. 10 study by the Covid-19 disease-modeling group at Imperial College London, which was adopted as a provisional consensus by many in the epidemiology and public health communities. It’s also within the range of 0.05% to 1% proposed in a March 17 op-ed article by Stanford Medical School professor John Ioannidis, although at the time the skeptical Ioannidis intimated that the true fatality rate was likely to come out toward the low end.


                                    Ioannidis has his own running meta-analysis, based only on studies of the prevalence of coronavirus antibodies, that puts the median fatality rate at 0.24% but acknowledges that in the areas hardest-hit by Covid-19 it’s 0.9%. For a variety of reasons, fatality-rate estimates from places with high Covid-19 prevalence are more likely to be accurate than those from places with low prevalence, plus if you’re trying to estimate a population-wide fatality rate then areas where the disease is widespread ought to weigh more heavily than those where it isn’t, so this doesn’t seem incompatible with an overall rate of 0.6% or 0.7%.


                                    The varying results from different antibody studies do suggest that the disease may be less deadly where it is less prevalent — because health-care systems aren’t overburdened, and possibly because viral loads are lower — which seems like an important factor in deciding whether interventions to slow the spread of the disease are worth the effort. Improved medical techniques and treatments also appear to be reducing the severity of the disease, which could cut the fatality rate over time while also increasing the rewards to delaying tactics.


                                    Some of these delaying tactics have of course come at huge economic cost, raising questions about whether the dangers posed by Covid-19 really merited such a drastic response. I am not here to offer entirely satisfactory answers to those questions! But I thought it might be useful to take a closer look at how Covid-19’s risks stack up against those posed by the most comparable menace, influenza — both the seasonal variety and the occasional global pandemics. And though I realize that catching an infectious disease brings lots of other risks short of death, fatality rates do seem like the best metric for comparison available at the moment.


                                    Assigning an infection fatality rate to influenza turns out to be harder than one might think. That’s partly because there are multiple varieties of influenza, but also because until quite recently the terms “infection fatality rate” or “infection fatality risk” weren’t really a thing (in a search of the National Institutes of Health’s PubMed database of medical articles I found no uses of the former from before 2020 and only three of the latter). Instead researchers calculated what they usually called a “case fatality rate,” which in scientific articles I’ve perused has described:
                                    1. The percentage of hospitalizations that result in deaths.
                                    2. The percentage of laboratory-confirmed cases that result in deaths.
                                    3. The percentage of symptomatic cases that results in deaths.
                                    4. The percentage of infections that result in deaths.

                                    That’s confusing, right? To be sure, definition No. 3 seems to be the most commonly used, and for many diseases it’s roughly equivalent to No. 4 because almost all infections result in symptoms. But as you’ve surely heard, a high percentage of infections with the new coronavirus — probably around 40% to 45% — don’t ever cause significant symptoms. Influenza infections are if anything even more likely to be asymptomatic. One meta-analysis found that 65% to 85% may be; 50% to 75% is another frequently cited range.
                                    When I first went looking in early March for a rough estimate of seasonal influenza’s case fatality rate, 0.1% was what I most often encountered. This appears to be according to definition No. 3: If you divide the CDC’s estimates of deaths from influenza by its estimates of symptomatic cases over the past nine flu seasons, the resulting fatality rates range from 0.1% in 2018-2019 to 0.18% in 2010-2011, and average out to 0.13%.
                                    To compare influenza fatality rates with the Covid-19 infection fatality rate, though, one really needs to factor in those asymptomatic infections. A while back, University of Oxford infectious disease epidemiologist Christophe Fraser suggested on Twitter that doing so with seasonal influenza would deliver an infection fatality rate of about 0.04%. When I ran this estimate by influenza expert Lone Simonsen, a professor at Roskilde University in Denmark who used to work at the CDC and NIH, she endorsed it. One can also just take the 0.13% symptomatic-case fatality rate from the CDC and the low-end estimate that 50% of infections are asymptomatic and conservatively calculate an infection fatality rate of 0.065% — exactly one-tenth what the CDC currently estimates for Covid-19.
                                    That’s a tidy little result. Perhaps too tidy, given that seasonal influenza does appear to pose a greater danger to infants and toddlers than Covid-19 does. Only 25 Americans age 4 and younger have died from Covid-19, according to the CDC, while in most recent flu seasons the estimated fatalities for that age group have been in the low hundreds. Apart from that, though, the risk profile by age is quite similar for seasonal flu and Covid-19, with those 65 and older accounting for about 80% of U.S. deaths from both. Maybe Covid-19 isn’t exactly 10 times more dangerous than seasonal influenza, but it’s probably in that ballpark.
                                    This may seem hard to square with the CDC’s tally of 61,000 fatalities in the worst recent U.S. flu season, that of 2017-2018 — more than one-third of the 158,268 deaths attributed so far to Covid-19. Part of the explanation is of course that Covid-19 isn’t done with us yet. The CDC estimates that there were 45 million symptomatic influenza cases in the U.S. in 2017-2018, which if 50% of infections were asymptomatic would mean that 90 million Americans, or 28% of the population, were infected. Data scientist Youyang Gu’s handy infections tracker, which is based mostly on mortality data, estimates that just 9.2% of Americans had been infected with Covid-19 as of July 15.
                                    A bigger issue may be that the CDC’s annual influenza numbers are statistical-model-based estimates that include “influenza-like” respiratory illnesses and deaths for which influenza was just one of multiple causes, while the Covid-19 numbers are based on an actual count of deaths attributed to the disease by state authorities (although of course other underlying causes are often involved as well). Harvard and Emory medical school professors Jeremy Samuel Faust and Carlos del Rio suggested in May that a better comparison would be with the number of influenza deaths counted in the CDC’s National Healthcare Safety Network reports, which have ranged from 3,448 to 15,620 in recent years. In the CDC’s “underlying cause of death” data based on death certificates, the highest influenza fatality total in the past two decades was 11,164 in 2018.
                                    Another approach is simply to look at the overall number of weekly deaths and compare them with expectations based on past years’ data. According to the CDC there were 28,200 excess deaths over the course of the 2017-2018 flu season, and since late March of this year there have been an estimated 191,011. That’s almost seven times more and, again, the coronavirus isn’t done yet. Saying it’s roughly 10 times deadlier than the seasonal flu does not seem to be a great exaggeration. It may prove to be an understatement.


                                    Influenza pandemics are another matter. They occur when a strain of influenza to which most people have never been exposed, and for which vaccines are not immediately available, sweeps the world. Those 65 and older are often less affected by these pandemics than younger cohorts, possibly because they were exposed to similar influenza strains in their youth. During the 2009-2010 H1N1 pandemic, for example, about 80% of the deaths were among those under 65. But only an estimated 12,469 Americans died of the disease. Its overall case fatality rate was a very low 0.02% and the infection fatality rate surely lower than that, so there’s really no comparison between it and Covid-19.

                                    The pandemic influenza strains of 1968, 1957-1958 and 1918 were much more dangerous. 1 It’s tough to sort out the infection fatality rates from the case fatality rates in the literature, but there were antibody surveys conducted during and after the 1968 and 1957-1958 pandemics, and World Health Organization fatality-rate estimates of a bit under 0.2% for both seem to take at least some asymptomatic infections into account. There was no antibody testing in 1918 (the influenza virus wasn’t identified till 1933), but a 2011 paper co-authored by the aforementioned Christophe Fraser concluded on the basis of transmission patterns that there were few asymptomatic infections, meaning that the case fatality rate, usually estimated between 2% and 3%, may represent something close to the infection fatality rate. Another way of measuring is just to count estimated U.S. deaths from the three pandemics, which were, going back in time from 1968, 100,000, 116,000 and 675,000. As a share of the population, that’s equivalent to 164,000, 221,000 and 2.1 million deaths today.

                                    A fuller comparison would adjust for changes in the age distribution of the population. U.S. Army epidemiologist John F. Brundage did that a few years ago and concluded that an influenza strain with a virulence equivalent to 1918’s would have killed 1.3 million people in the U.S. in 2006, far less than a straight share-of-population calculation would predict. In his accounting, the aging of the U.S. had lessened the risk from a disease with mortality rates that were highest for infants and those in their 60s and 70s, but also quite high for young adults. Advances in medicine since 1918 surely would reduce the modern toll as well. Then again, a disease with the age profile of Covid-19 might have proved less deadly for the far-younger U.S. populace of 1918 than it is for us now.

                                    No matter what adjustments one makes, Covid-19 appears to be markedly less dangerous than the 1918 influenza, especially when you factor in that the latter wasn’t nearly as deadly in the U.S. as in some other countries. On the other hand, the current pandemic seems certain to pass 1968’s in population-adjusted U.S. fatalities — it probably already has, if you go by the excess mortality data — and quite likely to pass that of 1957-1958. If the coronavirus were to infect circa 30% of Americans, as those two are estimated to have done, at current fatality rates it would cause almost four times as many deaths (adjusted for population) as the 1968 pandemic and almost three times as many as 1957-1958. And because it is more infectious than influenza, Covid-19 might not stop at 30% in the absence of control measures. In one hard-hit area of Peru a recent antibody survey found that 71% of those tested had been infected; some neighborhoods of New York City may have infection rates nearly that high.
                                    Again, such comparisons are complicated by medical advances, changing demographics and the differing age profiles of the diseases. A 2016 study of excess mortality from the 1957-1958 pandemic, co-authored by the aforementioned Lone Simonsen, found that 44.1% of the excess deaths across 39 countries were among those 4 and younger, versus 32.5% among those 65 and older. There were, to be sure, a lot of small children in those days (11.3% of the U.S. population was 4 or younger, versus 6% now) and a lot fewer 65-plussers (8.9% then versus 16.5% now). Still, even in the absence of a quality-adjusted-life-years comparison that reflects the greater cost inherent in the loss of younger people’s lives, I think it’s fair to say that the 1957-1958 pandemic merits being at least mentioned in the same breath as Covid-19.
                                    Yet the reaction to it was nothing like that we’ve seen this year. There were school closures, but they were far from universal. There was also a sharp if short recession, with the percentage drop in U.S. real gross domestic product in the first quarter of 1958 the biggest on record until the second quarter of this year, but only a few contemporary observers appear to have attributed it to the pandemic.
                                    So why did life temporarily grind to a halt in much of the world for Covid-19 when it did not for a new strain of H2N2 influenza in 1957? One possibility is that public health officials, political leaders, the news media and many others have overreacted this time around. Another is that they underreacted in 1957 and 1958. Also, the U.S. and most of the rest of the world are much healthier and wealthier than they were in the 1950s and 1960s, meaning that a threat such as Covid-19 stands out more than it would have then, and that the resources available to fight it are greater. Again, I don’t think comparisons like those I’ve offered here tell us what the correct pandemic policies are. But they do at least help us better understand how Covid-19 stacks up, which is to say that it’s definitely the worst such pandemic to come along in 60 years and probably the worst in a century.
                                    • I'm using the CDC's dating here, which is based on when the pandemic hit hardest in the U.S. Internationally focused accounts often refer instead to the 1968-69, 1957-1959 and 1918-1919 pandemics.

                                    This column does not necessarily reflect the opinion of the editorial board or Bloomberg LP and its owners.


                                    To contact the author of this story:
                                    Justin Fox at justinfox@bloomberg.net
                                    To contact the editor responsible for this story:
                                    Stacey Shick at sshick@bloomberg.net


                                    Editado pela última vez por lll; 22 September 2020, 09:38.

                                    Comentário


                                      https://www.nature.com/articles/s41598-020-72611-5

                                      O estudo que foi citado nas noticias que usa modelos matemáticos para prever o que vai acontecer na Europa.

                                      Acesso livre.

                                      Comentário


                                        https://bmcmedicine.biomedcentral.co...41-7015-10-162

                                        Comentário


                                          https://www.folkhalsomyndigheten.se/...cal-report.pdf

                                          pags 17 e 28

                                          acho que no final disto tudo os valores serão ligeiramente menores

                                          Comentário


                                            https://www.healthline.com/health/in...istics#Vaccine

                                            Comentário


                                              Batizados, bodas e banquetes responsáveis por 67% dos novos casos conhecidos nos últimos dias

                                              Comentário


                                                History lessons: the Asian Flu pandemic

                                                Comentário


                                                  https://swprs.org/studies-on-covid-19-lethality/

                                                  https://www.acpjournals.org/doi/10.7326/M20-5352
                                                  Editado pela última vez por lll; 12 October 2020, 20:03.

                                                  Comentário


                                                    https://www.ncbi.nlm.nih.gov/pmc/articles/PMC3809029/

                                                    Comentário


                                                      Repetido

                                                      Comentário


                                                        Huge Study of Coronavirus Cases in India Offers Some Surprises to Scientists


                                                        The rate of death went down in patients over 65. Researchers also found that children of all ages became infected and spread the virus to others.

                                                        With 1.3 billion people jostling for space, India has always been a hospitable environment for infectious diseases of every kind. And the coronavirus has proved to be no exception: The country now has more than six million cases, second only to the United States.

                                                        An ambitious study of nearly 85,000 of those cases and nearly 600,000 of their contacts, published Wednesday in the journal Science, offers important insights not just for India, but for other low- and middle-income countries.

                                                        Among the surprises: The median hospital stay before death from Covid-19, the illness caused by the coronavirus, was five days in India, compared with two weeks in the United States, possibly because of limited access to quality care. And the trend in increasing deaths with age seemed to drop off after age 65 — perhaps because Indians who live past that age tend to be relatively wealthy and have access to good health care.

                                                        The contact tracing study also found that children of all ages can become infected with the coronavirus and spread it to others — offering compelling evidence on one of the most divisive questions about the virus.

                                                        And the report confirmed, as other studies have, that a small number of people are responsible for seeding a vast majority of new infections.

                                                        An overwhelming majority of coronavirus cases globally have occurred in resource-poor countries, noted Joseph Lewnard, an epidemiologist at the University of California, Berkeley, who led the study. But most of the data has come from high-income countries.

                                                        It still surprises me that it took until this point for a lot of data to come out of a low- or middle-income country about the epidemiology of Covid,” he said.

                                                        In particular, he added, few studies anywhere have done contact tracing at the scale of the study.

                                                        “I think it’s some of the most important data we collect in an epidemic in order to decide what kinds of interactions are safe, and what kinds are not,” he said. And yet, “data like this has not really been published very much.”

                                                        Though its overall total of cases is huge, the per capita number of cases reported daily in India — and in many other low-income countries, including in Africa — is lower than in Spain, France or even the United States. And its number of deaths has not yet topped 100,000 — which has surprised some scientists.

                                                        India “is a place where you would expect a disease like this to roar through, at least in the older populations,” said Dr. Krutika Kuppalli, an infectious disease expert at the Medical University of South Carolina. “They haven’t seen that as much as you would expect.”

                                                        India recorded its first case of Covid-19 on Jan. 30 in an Indian citizen evacuated from China. The government began screening travelers from China and other countries on Feb. 7 and extended these efforts to travelers by sea and land on March 15. The country shut down on March 25 but reopened two months later, despite soaring rates of infection.

                                                        The study focused on two southern Indian states, Andhra Pradesh and Tamil Nadu, which together have a population of about 128 million, and represent two of the five Indian states with the most cases. They also have among the most sophisticated health care systems in the country.

                                                        Contact tracers reached more than three million contacts of the 435,539 cases in these two states, although this still did not represent the full set of contacts. The researchers analyzed data for the 575,071 contacts for whom test information was available.

                                                        “I think what they were able to do is actually really remarkable, to be quite honest,” said Dr. Kuppalli, who has spent time in Tamil Nadu doing public health work. Contact tracing has proved difficult enough to do in the United States, she said. “I can’t imagine what it would be in a place like India, where it’s such a more crowded, crowded area.”

                                                        The contact tracing data revealed that the people infected first — known as index cases — were more likely to be male and older than their contacts. That may be because men are more likely to be out in situations where they might be infected, more likely to become symptomatic and get tested if they do become infected, or perhaps more likely to respond to contact tracers’ calls for information, Dr. Lewnard said.

                                                        He and his colleagues also looked at infections in contacts by age and sex, and found that infected people tend to spread the virus to those of similar ages.

                                                        That’s not surprising because people generally tend to mix with their own age groups, Jeffrey Shaman, an epidemiologist at Columbia University in New York, said: “That’s a fairly robust result.”

                                                        For example, more than 5,300 school-aged children in the study had infected 2,508 contacts but were more likely to spread the virus to other children of a similar age. Because the researchers were not able to get information for all of the contacts, they could not assess the children’s ability to transmit relative to adults. But the finding has relevance in the school debate, as some people have argued that children spread the virus to a negligible degree, if at all.

                                                        “The claims that children have no role in the infection process are certainly not correct,” Dr. Lewnard said. “There’s, granted, not an enormous number of kids in the contact tracing data, but those who are in it are certainly transmitting.”

                                                        Over all, the researchers found, 71 percent of the people in the study did not seem to have transmitted the virus to anyone else; instead, just 5 percent of people accounted for 80 percent of the infections detected by contact tracing.

                                                        This is different from the idea of “super spreader” events in which a single person infected hundreds of people at a crowded gathering, Dr. Lewnard said.

                                                        The researchers noticed a key difference in those who did become sick and were hospitalized: They died on average within five days of being hospitalized, compared with two to eight weeks in other countries. The patients in India may deteriorate faster because of other underlying conditions like diabetes and high blood pressure or poor overall health, Dr. Lewnard said.

                                                        Access to health care may also play a role, said Dr. Ashish Jha, dean of the School of Public Health at Brown University, who has advised the Indian government on its health care infrastructure before the pandemic.

                                                        Although India has some excellent hospitals, most hospitals in the country are ill-equipped, have few beds and fewer doctors, Dr. Jha said. Most people in India also do not have health insurance that would allow them care from private hospitals.

                                                        “There are going to be these large financial barriers that make people wait until they get very, very sick,” Dr. Jha said.

                                                        Conditions may be similarly dire in other resource-poor nations. The amount of time patients may spend in the hospital is a “key planning parameter” for governments preparing for outbreaks, Dr. Lewnard said, and longer hospital stays can create bottlenecks during a surge.

                                                        Among those infected, the researchers found an overall case-fatality rate of 2 percent. The rate rose sharply with age, as it did elsewhere. But unlike in other countries, after age 65, the deaths sloped downward again.

                                                        “It leads to a younger death distribution over all in the population than you would project,” Dr. Lewnard said. The difference was not fully accounted for by the distribution of ages in the population.

                                                        At 69 years, the life expectancy in India is 10 years lower than in the United States. The Indians who survive into old age may be more likely to survive the disease because of better health and access to health care, he and others said.

                                                        A majority of Indians have a hardscrabble existence, earning a living as farmers, factory workers or day laborers, Dr. Jha said.

                                                        “Those jobs are physically very, very demanding, and they have high fatality rates,” he added. “They are just much less likely to make it into their late 70s or 80s compared to people who are white-collar workers.”

                                                        Dr. Jha said he appreciated the study over all, but cautioned against extrapolating its findings too far. He is from the state of Bihar, among the most rural and poor states in India, whereas Andhra Pradesh and Tamil Nadu, the two states in the study, are among the best equipped to deal with an outbreak, he said.

                                                        “It is really important to understand this is not the experience of Bihar, this is not the experience of D.R.C.,” he said, referring to the Democratic Republic of Congo. “This is a much rosier picture than what you are likely to see in those places.”

                                                        But other experts were impressed with the scale and scope of the study. “India has been the nexus of the most cases recorded for the last three, four weeks,” Dr. Shaman said.

                                                        “To see it in the Indian milieu is very important,” he said. “We can’t just study it in a few countries and then walk away.”

                                                        Comentário


                                                          Comentário


                                                            The Effects Of Wearing A Face Mask

                                                            A new study suggests that face masks have a negligible negative effect on the levels of carbon dioxide and oxygen that a person breathes.The findings even hold true for individuals with chronic obstructive pulmonary disease (COPD).
                                                            The research, which appears in the journal Annals of the American Thoracic Society, contributes to dispelling some of the myths surrounding the use of face masks in the context of the ongoing COVID-19 pandemic.
                                                            Face masks

                                                            As the world gains access to more information about SARS-CoV-2, the virus that causes COVID-19, scientists have become increasingly convinced that masks can help reduce its spread.
                                                            The primary way that SARS-CoV-2 transmits involves viral particles entering a person’s respiratory tract. This typically happens after another person coughs, sneezes, or speaks near them, producing droplets or aerosols that transport the virus.
                                                            Consequently, face masks play an important role in reducing exposure to the virus and limiting the amount of the virus that a person can project toward others.
                                                            There is a growing consensus about the value of face masks in reducing the spread of SARS-CoV-2, though this has not always been the case.
                                                            Initially, little was known about the new virus and policy had to be developed based on the best available evidence, following scientific models that drew on data from earlier epidemics involving similar viruses.
                                                            As a consequence, guidance about mask wearing has varied from country to country, and some major health bodies, including the World Health Organization (WHO), have changed their advice over time.
                                                            In many ways, these changes and discrepancies are inevitable when providing advice about an urgent public health crisis while scientists are continually discovering new information. Dogmatically sticking to a position despite the changing evidence or offering advice when there is little evidence to justify it are unlikely to be better approaches.
                                                            However, research has shown that significant changes in official guidance reduce people’s trust in the science that is the basis of the policy.
                                                            In addition, the use of face masks has become a political battleground, with vocal proponents on the right denouncing enforced mask wearing, either as an infringement of freedom or a suspected element in a broad conspiracy that COVID-19 was mobilized or fabricated.
                                                            In this context, some people have proposed that face masks are a threat to public health, supposing that the masks reduce the amount of inhaled oxygen or increase the amount of inhaled carbon dioxide.
                                                            COPD patients

                                                            To test this theory, the researchers behind the present small study recruited 15 house staff physicians, who had no health issues affecting their lungs, and 15 veterans with COPD.
                                                            The veterans were in the hospital so that doctors could check their oxygen levels as part of their regular COPD monitoring.
                                                            The monitoring involved, among other things, blood oxygen levels checked with a blood test before and after a 6-minute walking exercise. This exercise was done while wearing a mask, as per hospital protocol during a pandemic.
                                                            The researchers used a LifeSense monitor to check the baseline room air, and then continually took measurements throughout the time that the participants were wearing masks.
                                                            No significant changes

                                                            The researchers found no clinically significant changes in any of the participants’ end tidal carbon dioxide measurements — the amount of carbon dioxide in an exhalation. They also found no changes in blood oxygen levels after 5 or 30 minutes of wearing a mask while resting.
                                                            As expected, the participants with COPD had lower blood oxygen levels than those without the respiratory disease. No participant with COPD had any major changes in their gas exchanges due to wearing a mask.
                                                            In the words of senior study author Dr. Michael Campos, of the Miami Veterans Administration Medical Center and the University of Miami’s Miller School of Medicine, “We show that the effects are minimal at most, even in people with very severe lung impairment.”
                                                            If a person experiences shortness of breath while wearing a mask, the study suggests, this does not result from reduced oxygen levels or an increase in carbon dioxide levels.
                                                            Dr. Campos explains, “Dyspnea, the feeling of shortness of breath felt with masks by some, is not synonymous [with] alterations in gas exchange. It likely occurs from restriction of air flow with the mask in particular when higher ventilation is needed on exertion.”
                                                            While recognizing that masks may be uncomfortable for some, the authors make clear that wearing a mask is key in maintaining the health of the wearer and those around them. They write:
                                                            “It is important to inform the public that the discomfort associated with mask use should not lead to unsubstantiated safety concerns, as this may attenuate the application of a practice proven to improve public health.”
                                                            Though the study was small, its findings emphasize that wearing a mask is still important — given the mounting evidence that masks reduce viral transmission and the lack of any evidence to the contrary.
                                                            As Dr. Campos summarizes, “The public should not believe that masks kill.”
                                                            Medical reference: Medical News Today

                                                            Comentário


                                                              lll, desculpa lá, eu tinha-te perguntado no tópico da Covid (em resposta a um post teu sobre as células T e a imunidade cruzda), mas com a frequência de posts que aquilo tem, pode-te ter saltado. Pergunto-te aqui:

                                                              A propósito do artigo que o colega Qualnhick partilhou (https://medicalxpress.com/news/2020-...-immunity.html), este já foi peer-reviewed?

                                                              Se sim, de facto é uma boa notícia!

                                                              Repara, pode ser arriscado dizer isto ainda, mas a imunidade de grupo pode não estar longe. E a OMS nunca vai admitir tal porque, derivado aos interesses políticos que essa organização tem, não pode pôr em causa a venda das vacinas, quando estas ficarem disponíveis. Porque se a imunidade de grupo estiver perto, para que servirá a vacina? A generalidade da malta já tem reticência em tomá-la, então com isto das imunidades e células T, ainda menos!

                                                              Comentário

                                                              AD fim dos posts Desktop

                                                              Collapse

                                                              Ad Fim dos Posts Mobile

                                                              Collapse
                                                              Working...
                                                              X